


|
|
|
|
|
|
|
|
|
version 2004.5 (Modified)
The 4D Server window contains information that allows you to manage various aspects of your database system for administrative purposes:
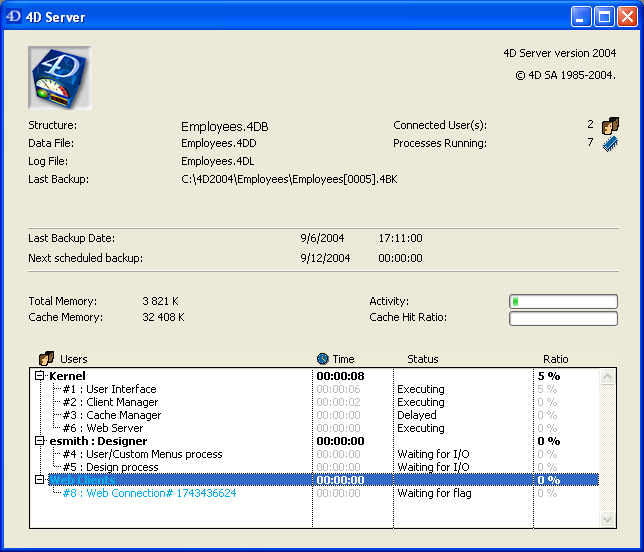
The server window is divided into two panes:
• The upper pane displays information about the files used by the server, back-ups and memory,
• The lower pane displays information about the clients connected to the server and the processes currently running.
Server Information Pane
The Server Information Pane describes general information about the server:
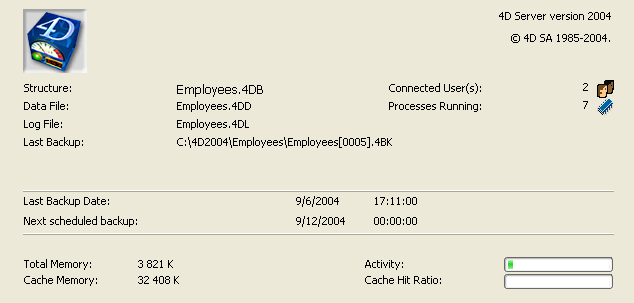
It contains the following data:
• 4D Server version number: The version number of the 4D Server application currently in use.
• Structure File: The name of the structure file opened by 4D Server.
• Data File: The name of the data file associated with the structure file.
• Log File: The name of the log file created to keep track of database operations. A log file is created by default when the database is created.
• Last Backup: Access path and name of the last backup file of the database.
• Connected Users: The total number of users currently connected.
• Processes Running: The number of processes currently running. This number includes all processes (kernel, user connections, Web connections and stored procedures).
• Backup progress area: This area displays a progress bar when a backup is underway. The X button can be used to manually stop an automatic backup in progress:

• Last Backup Date: Date and time when the last backup of the database was carried out.
• Next scheduled backup: Date and time of the next scheduled automatic backup. This information comes from the automatic backup configuration set in the Preferences dialog box of the database.
• Total Memory: The memory allocated to 4D Server's kernel. This value is set dynamically by the operating system depending on the use of the database and the available resources.
• Cache Memory: The amount of memory allocated to the cache. The size of the cache controls the amount of data that can be kept in memory to reduce the number of times the disk is accessed. Cache memory can be configured on the Database/Data Management page of the application Preferences. For more information about this, refer to the Design Reference manual of the 4D documentation.
• Activity thermometer: A thermometer indicating the current level of server activity. The Activity thermometer indicates the overall activity on the network. The more requests sent to the server, the higher the thermometer reading.
• Cache Hit Ratio thermometer: A thermometer indicating the level of cache use. The higher the thermometer reading, the more cache is being used. If the thermometer is always at a low level, you may want to consider decreasing the size of the cache.
The Cache Hit Ratio Window
The Cache Hit Ratio thermometer can also be used as a button. Clicking it displays the Cache Hit Ratio window:
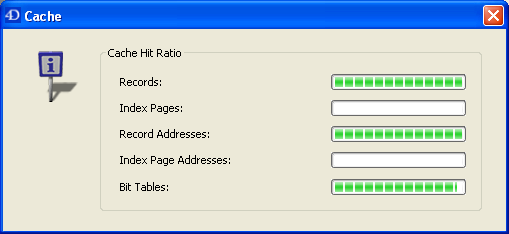
This window provides additional thermometers indicating how the cache is being used. For each type of data that can be kept in the cache, there is a thermometer indicating how much of the data is present in the cache. A higher reading is considered advantageous, because accessing that type of data will require fewer occurrences of disk access (hits).
Records, Record Addresses and Index Page Addresses are progressively loaded in the cache when you work with records. Index Pages and Bit Tables are progressively loaded in the cache when you modify data by adding, modifying or deleting records.
Process Information Pane
The Process Information Pane lists the connected users and the processes that are currently running:
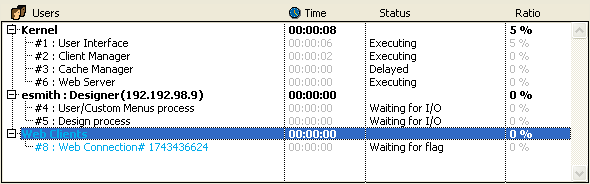
All client processes, the connection processes (excluding processes local to the workstation), are included in the list. You can hide and show processes for the kernel or for a particular user by clicking the cross (Windows) or arrow (Macintosh) to the left of the user name. Beginning with version 2004.5, the IP address of each user connected to the database via 4D Client is displayed in parentheses after the name of the client machine. When no clients are connected, only information about the server engine activity is displayed, as well as optional stored procedures.
The 4D Server engine is managed by four kernel processes:
• User Interface: Controls the user interface of the server window itself.
• Client Manager: Manages all connections to the server and ensures that each client is given processing time.
• Cache Manager: Manages the flushing of data to disk.
• Web Server: Manages Web connection attempts. Starting the Web Server process does not mean that you open an actual Web connection, it just means that you allow Web users to initiate Web connections.
For each process, the server window provides the following information:
• Name of the process
• Amount of time (in seconds) spent in each process since it started
• Status of the process
• Percentage of time spent by 4D Server in the process (ratio).
In order to differenciate processes, the administration window displays the processes as follows:
• Kernel processes in black
• User connection processes in black
• Web connection processes in cyan
• Stored procedures processes in blue
• 4D Open-based connection processes in green
Note: Processes being aborted may appear in red, for a short time.
See Also
|
|
|
|
|
|
|
|
|