


|
|
|
|
|
|
|
|
|
|
version 6.5 (Modified)
The term Debugger comes from the term bug. A bug in a method is a mistake that you want to eliminate. When an error has occurred, or when you need to monitor the execution of your methods, you use the debugger. A debugger helps you find bugs by allowing you to slowly step through your methods and examine method information. This process of stepping through methods is called tracing.
You can cause the Debugger window to display and then trace the methods in the following ways:
• Clicking the Trace button in the Syntax Error Window
• Using the TRACE command
• Clicking the Debug button in the Execute Method window (User environment).
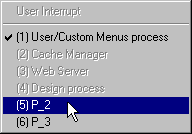
• Pressing Alt+Shift+Right click (Windows) or Control+Option+Command+Click (Macintosh) while a method is executing, then selecting the process to trace in the pop-up menu:
• Clicking the Trace button when a process is selected in the Process page of the Runtime Explorer.
• Creating or editing a break point in the Method Editor window, or in the Break and Catch pages of the Runtime Explorer.
Note: If a password system exists for the database, only the designer and users belonging to the group that has structure access privileges can trace methods.
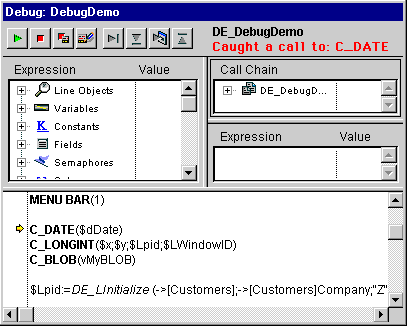
The Debugger window is displayed here:
You can move the Debugger Window and/or resize any of its internal window panes as necessary. Displaying a new debug window uses the same configuration (size and position of the window, placing of the division lines and contents of the area that evaluates the expressions) as the last window displayed in the same session.
4D is a multi-tasking environment. If you run several user processes, you can trace them independently. You can have one debugger window open for each process.
Execution Control Tool Bar Buttons
Nine buttons are located in the Execution Control Tool Bar at the top of the Debugger window:
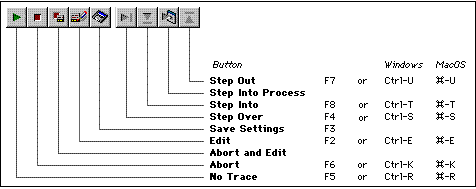
No Trace Button
Tracing is halted and normal method execution resumes.
Note: Shift+F5 or Shift+click on the No Trace button resumes execution. It also disables all the subsequent TRACE calls for the current process.
Abort Button
The method is halted, and you return to where you were before you started executing the method. If you were tracing a form or object method executing in response to an event, it is stopped and you return to the form. If you were tracing a method executing from within the Custom Menu environment, you return to the Custom Menu environment.
Abort and Edit Button
The method is halted as if you clicked on Abort. Also, if necessary, 4th Dimension opens and brings the Design environment process to the front, then opens a Method Editor window for the method that was executing at the time the Abort and Edit button was clicked.
Tip: Use this button when you know which changes are required in your code and when these changes are required to pursue the testing of your methods. After you are finished with the changes, rerun the method.
Edit Button
Clicking the Edit button does the same as Clicking Abort and Edit button, but does not abort the current execution. The method execution is paused at that point. If necessary, 4th Dimension opens and brings the Design environment process to the front, then opens a Method Editor window for the method that was executing at the time the Edit button was clicked.
Important: You can modify this method; however, these modifications will not appear or execute in the instance of the method currently being traced in the debugger window. After the method has either aborted or completed successfully, the modifications will appear on the next execution of this method. In other words, the method must be reloaded so its modifications will be taken into account.
Tip: Use this button when you know which changes are required in your code and when they do not interfere with the rest of the code to be executed or traced.
Tip: Object Methods are reloaded for each event. If you are tracing an object method (i.e., in response to a button click), you do not need to leave the form. You can edit the object method, save the changes, then switch back to the form and retry. For tracing/changing form methods, you must exit the form and reopen it in order to reload the form method. When doing extensive debugging of a form, a trick is to put the code (that you are debugging) into a project method that you use as subroutine from within a form method. In doing so, you can stay in the form while you trace, edit, and retest your form, because the subroutine is reloaded each time it is called by the form method.
Save Settings Button
Saves the current configuration of the debug window (size and position of the window, placing of the division lines and contents of the area that evaluates the expressions), so that it will be used by default each time the database is opened. These parameters are stored in the database's structure file.
Step Over Button
The current method line (the one indicated by the yellow arrow—called the program counter) is executed, and the Debugger steps to the next line. The Step Over button does not step into subroutines and functions; it stays at the level of the method you are currently tracing. If you want to also trace subroutines and functions calls, use the Step Into button.
Step Into Button
On execution of a line that calls another method (subroutine or function), this button causes the Debugger window to display the method being called and allows you to step through this method. The new method becomes the current (top) method in the Call Chain pane of the Debugger window. On execution of a line that does not call another method, this button acts in the same manner as the Step Over button.
Step Into Process Button
On execution of a line that creates a new process (i.e., calling the command New process), this button opens a new Debugger window that allows you to trace the process method of the newly created process. On execution of a line that does not creates a new process, this button acts in the same manner as the Step Over button.
Step Out Button
If you are tracing subroutines and functions, clicking on this button allows you to execute the entire method currently being traced and to step back to the caller method. The Debugger window is brought back to the previous method in the call chain. If the current method is the last method in the call chain, the Debugger window is closed.
Execution Control Tool Bar Information
On the right side of the execution control tool bar, the debugger provides the following information:
• The name of the method you are currently tracing (displayed in black)
• The problem caused the appearance of the Debugger window (displayed in red)
Using the example window shown above, the following information is displayed:
• The method DE_DebugDemo is the method being traced.
• The debugger window appeared because it detected a call to the command C_DATE and this command was one of the commands to be caught.
Here are the possible reasons for the debugger to appear and for the message (displayed in red):
• TRACE Command: A call to TRACE has been issued.
• Break Point Reached: A temporary or persistent break point has been encountered.
• User Interrupt: You used Alt+Shift+Right click (Windows) or Control+Option+Command+Click (Macintosh), or you clicked on the Trace button in the Process page of the Design environment Runtime Explorer.
• Caught a call to: Name of the command: A call to a 4D command to be caught is on the point of being performed.
• Stepping into a new process: You used the Step Into Process button and this message is displayed by the Debugger window opened for the newly created process.
The Debugger Window's Panes
The Debugger window consists of the previously described Execution Control Tool Bar and four resizable panes:
The first three panes use easy-to-navigate hierarchical lists to display pertinent debugging information. The fourth one, Source Code Pane, displays the source code of the method being traced. Each pane has its own function to assist you in your debugging efforts. You can use the mouse to vertically and horizontally resize the debugger window and also each pane. In addition, the first three panes include a dotted separation line between the two columns they display. Using the mouse, you can move this dotted line to horizontally resize the columns, at your convenience.
See Also
Break List, Call Chain Pane, Catching Commands, Custom Watch Pane, Debugger Shortcuts, ON ERR CALL, Source Code Pane, Syntax Error Window, TRACE, Watch Pane, Why a Debugger?.
|
|
|
|
|
|
|
|
|
|