


|
|
|
|
|
|
|
|
|
|
version 6.0
One method may call other methods, which may call other methods. For this reason, it is very helpful to see the chain of methods, or Call Chain, during the debugging process. The Call Chain pane, which provides this useful function, is the top right pane of the Debugger window. This pane is displayed using a hierarchical list. Here is an example of the Call Chain pane:
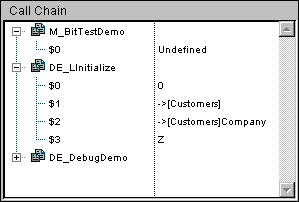
• Each main level item is a name of a method. The top item is the method you are currently tracing, the next main level item is the name of the caller method (the method that called the method you are currently tracing), the next one is the caller's caller method, and so on. In the example above, the method M_BitTestDemo is being traced; it has been called by the method DE_LInitialize, which has been called by DE_DebugDemo.
• Double-clicking the name of a method in the Call Chain pane "transports" you back to the caller method, displaying its source code in the Source code pane. In doing so, you can quickly see "how" the caller method made its call to the called method. You can examine any stage of the call chain this way.
• Clicking the node next to a Method name expands or collapses the parameter ($1, $2...) and the optional function result ($0) list for the method. The values appear on the right side of the pane. Clicking on any value on the right side allows you to change the value of any parameter or function result. In the figure above:
1. M_BitTestDemo has not received any parameter.
2. M_BitTestDemo's $0 is currently undefined, as the method did not assign any value to $0 (because it has not executed this assignment yet or because the method is a subroutine and not a function).
3. DE_LInitialize has received three parameters from DE_DebugDemo. $1 is a pointer to the table [Customers], $2 is a pointer to the field [Customers]Company, and $3 is an alphanumeric parameter whose value is "Z".
• After you have deployed the parameter list for a method, you can also drag and drop parameters and function results to the Custom Watch pane.
See Also
Custom Watch Pane, Debugger, Debugger Shortcuts, Source Code Pane, Watch Pane.
|
|
|
|
|
|
|
|
|
|