


|
|
|
|
|
|
|
|
|
|
version 6.5 (Modified)
The Watch pane is displayed in the top left corner of the Debugger window, below the Execution Control Tool Bar. Here is an example:
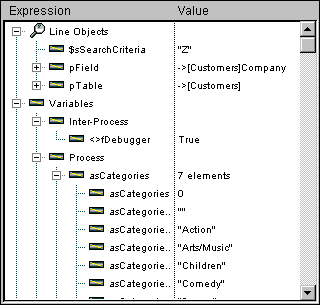
The Watch pane displays useful general information about the system, the 4D environment, and the execution environment.
The Expression column displays the names of the objects or expressions. The Value column displays the current value of corresponding the object or expression.
Clicking on any value on the right side of the pane allows you to modify the value of the object, if this is permitted for that object.
The multi-level hierarchical lists are organized by theme at the main level. The themes are:
• Line Objects
• Variables
• Constants
• Fields
• Semaphores
• Sets
• Processes
• Named Selections
• Information
• Cache Statistics
Depending on the theme, each item may have one or several sublevels. Clicking the list node next to a theme name expands or collapses the theme. If the theme is expanded, the items in that theme are visible. If the theme has several levels of information, click the list node next to each item for exploring all the information provided by the theme.
At any point, you can drag and drop themes, theme sublists (if any), and theme items to the Custom Watch pane.
Cache Statistics: Displays statistics regarding the use of tables, index pages, and named selections that are loaded in 4D's cache. The expressions from this theme cannot be modified.
Information: Displays general information, such the current Default Table (if any). The expressions from this theme cannot be modified.
Named Selections: Lists the process named selections that are defined in the current process (the one you're currently tracing); it also lists the interprocess named selections. For each named selection, the Value column displays the number of records and the table name. This list may be empty if you do not use named selections. The expressions from this theme cannot be modified.
Processes: Lists the processes started since the beginning of the working session. The value column displays the time used and the current state for each process (i.e., Executing, Paused, and so on). The expressions from this theme cannot be modified.
Sets: Lists the sets defined in the current process (the one you're currently tracing); it also lists the interprocess sets. For each set, the Value column displays the number of records and the table name. This list may be empty if you do not use sets. The expressions from this theme cannot be modified.
Semaphores: Lists the local semaphores currently being set. For each semaphore, the Value column provides the name of the process that sets the semaphore. This list may be empty if you do not use semaphores. The expressions from this theme cannot be modified. Global semaphores are not displayed.
Tables & Fields: This theme lists the tables and fields in the database; it does not list subfields. For each Table item, the Value column displays the size of the current selection for the current process as well as (if the Table item is expanded) the number of locked records. For each Field item, the Value column displays the value of the field (except picture, subtable, and BLOB) for the current record, if any. In this theme, the field values can be modified (there is no undo), but the table information cannot.
Constants: Displays predefined constants provided by 4D. like the Constants page of the Explorer window. The expressions from this theme cannot be modified.
Variables: This theme is composed of the following subthemes:
• Interprocess: Displays the list of the interprocess variables being used at this moment. This list can be empty if you do not use interprocess variables. The values of the interprocess variables can be modified.
• Process: Displays the list of the process variables being used by the current process. This list is rarely empty. The values of the process variables can be modified.
• Local: Displays the list of the local variables being used by the method being traced (the one being shown in the source code pane). This list can be empty if no local variable is used or has not yet been created. The values of the local variables can be modified.
• Parameters: Displays the list of parameters received by the method. This list can be empty if no parameter were passed to the method being traced (the one being shown in the source code pane). The values of the parameters can be modified.
• Self Pointer: Displays a pointer to the current object if you are tracing an Object Method. This value cannot be modified
Note: You can modifiy String, Text, Numeric, Date, and Time variables; in other words, you can modify the variables whose value can be entered with the keyboard.
Arrays, like other variables, appear in the Interprocess, Process, and Locals subthemes, depending on their scope. The debugger displays each array with an additional hierarchical level; this enables you to obtain or change the values of the array elements, if any. The debugger displays the first 100 elements, including the element zero. The Value column displays the size of the array in regard to its name. After you have deployed the array, the first sub-item displays the current selected element number, then the element zero, then the other elements (up to 100). You can modifiy String, Text, Numeric, and Date arrays. You can modify the selected element number, the element zero, and the other elements (up to 100). You cannot modify the size of the array.
Reminder: At any time, you can drag and drop an item from the Watch pane to the Custom Watch pane, including an individual array element.
Line Objects
This theme displays the values of the objects or expressions that are:
• used in the line of code to be executed (the one marked with the program counter—the yellow arrow in the Source Code pane), or
• used in the previous line of code.
Since the previous line of code is the one that was just executed before, the Line Objects theme therefore shows the objects or expressions of the current line before and after that the line was executed. Let's say you execute the following method:
| TRACE | ||
| a:=1 | ||
| b:=a+1 | ||
| c:=a+b | ||
| ` ... |
1. You enter the Debugger window with the Source Code pane program counter set to the line a:=1. At this point the Line Objects theme displays:
a: Undefined
The a variable is shown because it is used in the line to be executed (but has not yet been initialized).
2. You step one line. The program counter is now set to the line b:=a+1. At this point, the Line Objects theme displays:
| a: | 1 | |
| b: | Undefined |
The a variable is shown because it is used in the line that was just executed and was assigned the numeric value 1. It is also shown because it is used in the line to be executed as the expression to be assigned to the variable b. The b variable is shown because it is used in the line to be executed (but has not yet been initialized).
3. Again, you step one line. The program counter is now set to the line c:=a+b. At this point the Line Objects theme displays:
| c: | Undefined | |
| a: | 1 | |
| b: | 2 |
The c variable is shown because it is used in the line to be executed (but has not yet been initialized). The a and b variables are shown because there were used in the previous line and are used in the line to be executed. And so on...
The Line Objects theme is a very convenient tool—each time you execute a line, you do not need to enter an expression in the Custom Watch pane, just watch the values displayed by the Line Objects theme.
Speed Menu
Addtional options are provided by the Speed Menu of the Watch pane. To display this menu:
• On Windows, click anywhere in the Watch pane using the right mouse button.
• On Macintosh, Control-Click anywhere in the Watch pane.
The Speed Menu of the Watch pane is shown here:
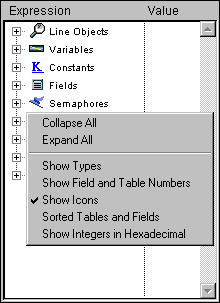
• Collapse All: Collapses all levels of the Watch hierarchical list.
• Expand All: Expand all levels of the Watch hierarchical list.
• Show Types: Displays the object type for each object (when appropriate).
• Show Field and Table Numbers: Displays the number of each table or field of the Fields. If you work with table or field numbers, or with pointers using the commands such as Table or Field, this option is very useful.
• Show Icons: Displays an icon denoting the object type for each object. You can turn this option off in order to speed up the display, or just because you prefer to use only the Show Types option.
• Sorted Tables and Fields: Forces the table and fields to be displayed in alphabetical order, within their respective lists.
• Show Integers in Hexadecimal: Numbers are usually displayed in decimal notation. This option displays them in hexadecimal notation. Note: To enter a numeric value in hexadecimal, type 0x (zero + "x"), followed by the hexadecimal digits.
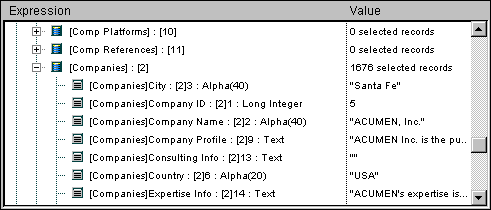
The following is a view of the Watch pane with all options selected:
See Also
Call Chain Pane, Custom Watch Pane, Debugger, Debugger Shortcuts, Source Code Pane.
|
|
|
|
|
|
|
|
|
|